The Best “Proven” Day Trading System - Perfect for first timers - 88% WIN!
Master the Momentum: Your Gateway to Rules-Based Trading Success
Welcome to the ultimate destination for mastering the synergy between the MACD and RSI indicators. Whether you are navigating the fast-paced world of day trading or perfecting your approach to mid-term swing trading, our platform provides the precision tools and educational depth you need to trade with confidence. We move beyond guesswork by offering a backtested, high-probability framework designed to identify bullish crossovers and RSI confirmations across stocks, ETFs, and major indices. By combining trend-following momentum with overbought and oversold oscillators, we help you filter out the noise and focus on the signals that truly matter.
Smarter Scanning, Better Decisions
Take control of your portfolio with our powerful MACD RSI Stock Ticker software, engineered to scan hundreds of assets in real time. Designed to remove the emotional friction from your trading day, our software highlights technical setups, earnings dates, and price movements exactly as they trigger. Join a community of traders dedicated to a consistent, rules-based system similar to the Trading Cafe, and explore our library of tutorials and live market examples. From fine-tuning indicator settings to implementing complex swing trading strategies, your journey toward becoming a disciplined, profitable trader starts here at macd-rsi.com.
A simple rule based strategy to follow
The rules …
MACD and RSI, bullish or bearish but in the same direction.
MACD crossover in the last two days.
RSI overbought (>70) or oversold (<30).
Downloadable software to do the work
Choose your list of stocks (tickers).
These can be stocks, forex pairs, indices and up to 250 of them.
Save them for future use and retrieve old lists easily.
Set the system and let it find any potential entry points on a daily basis.
BACK TEST
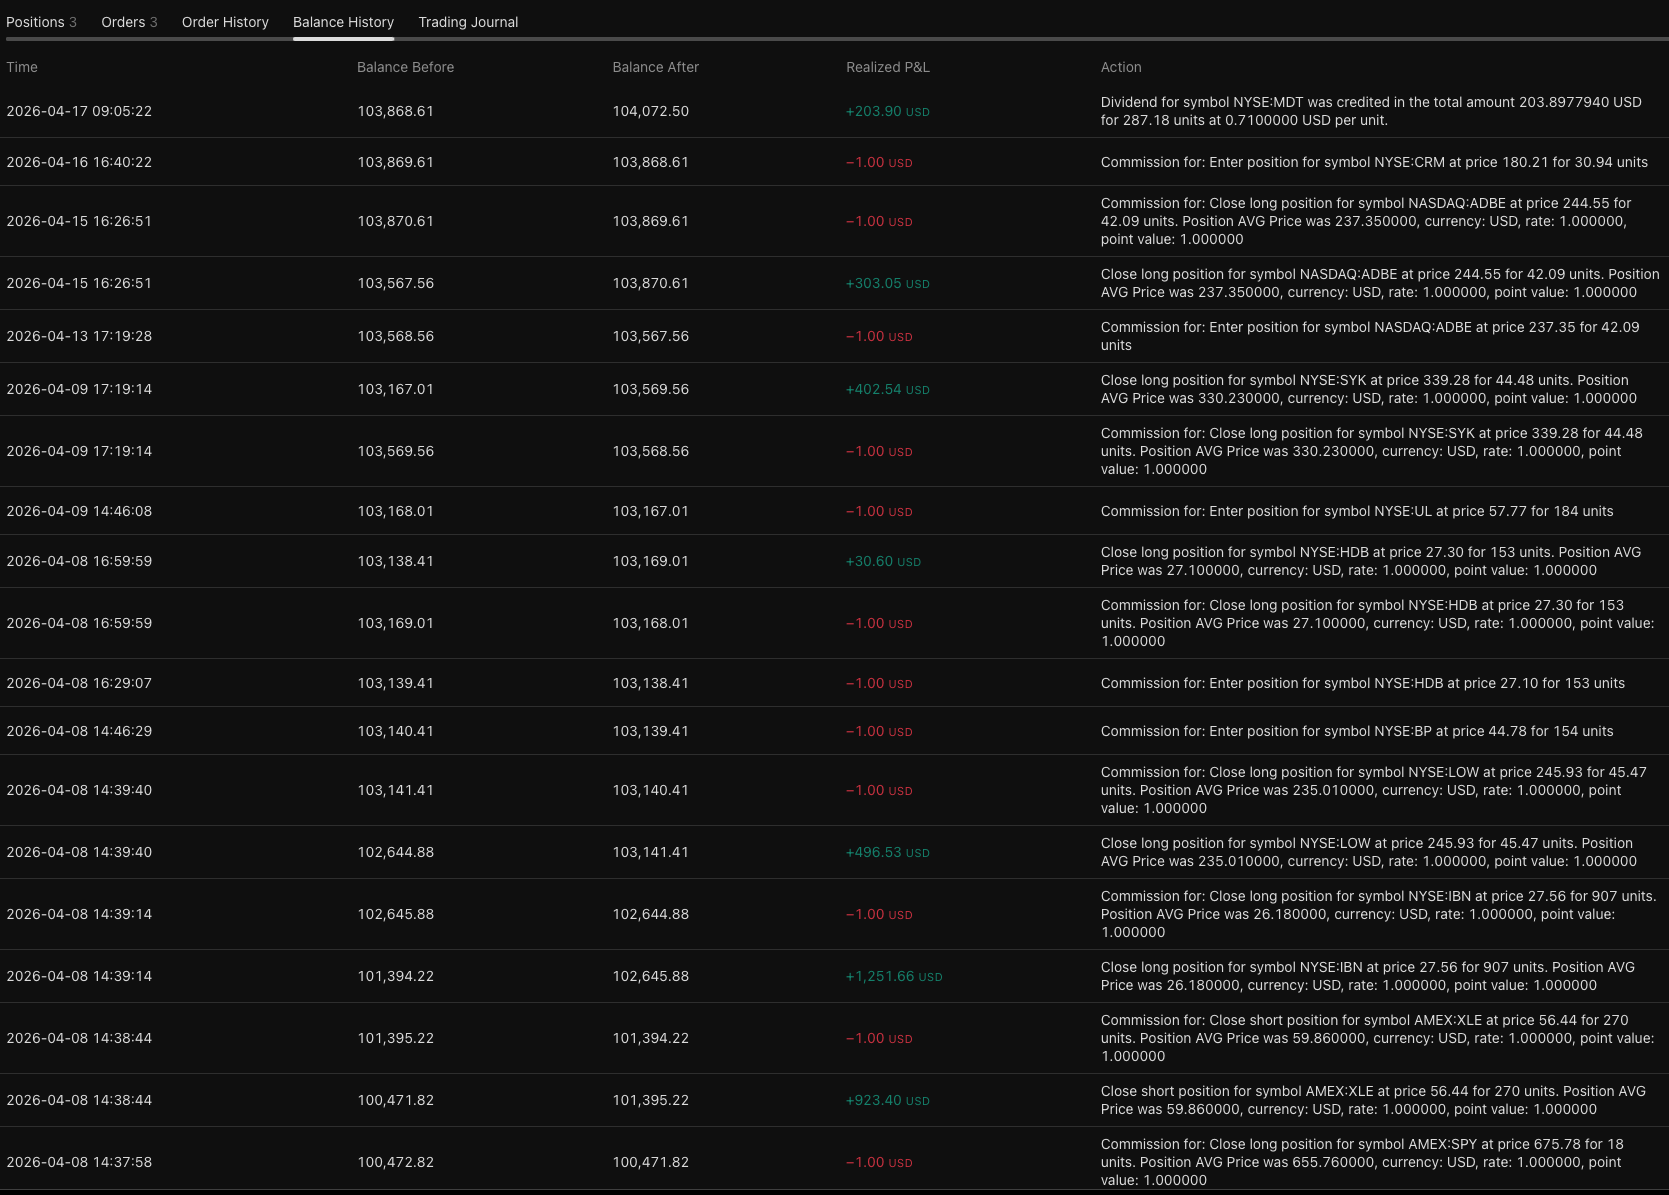
Opposite there are a list of trades taken one after the other on the familiar trading platform called “TRADING VIEW”.
This platform enables you to link to many other trading accounts and is hugley versatile.
If you do not have trading view here is a link for a discount.
https://www.tradingview.com/?aff_id=167353
Once you have Trading View installed and running, use the “Back Test” tool to look at these listed trades and see where the Take Profit (TP) or Stop Loss (SL) took place.
NEW TRADERS
Many new traders use prop firms to test their experience and one of the best is FXIFY. If you would like to try one of their funded challenges the link below will give you some discount.
Take the trade and wait for the signal to close
Once a signal is found, use your trading platform to take the trade.
When the stock gets to the RSI 50 you will be notified by email.
Then back to your platform to close the trade!
Each of these trades were identified by the software and as you can see 88% of them succeeded!