Recent trades
Opposite is a screen shot of trades completed between 8th April 2026 and 17th April 2026 on a standard trading platform you’ll likely recognise. Check the trades for yourself. The market is NYSE and the tickers are in the list.
It is based on a paper trading account of $100,000 and each trade is set at 0.5% risk of total balance. Trades listed below were taken once alerted, and the win rate is 88%. Obviously this will change and depends highly on your “Take Profit” psychology!
“BACKTEST” the trades as shown and see for yourself?
Trades can last a single day or even weeks, recent trades below.
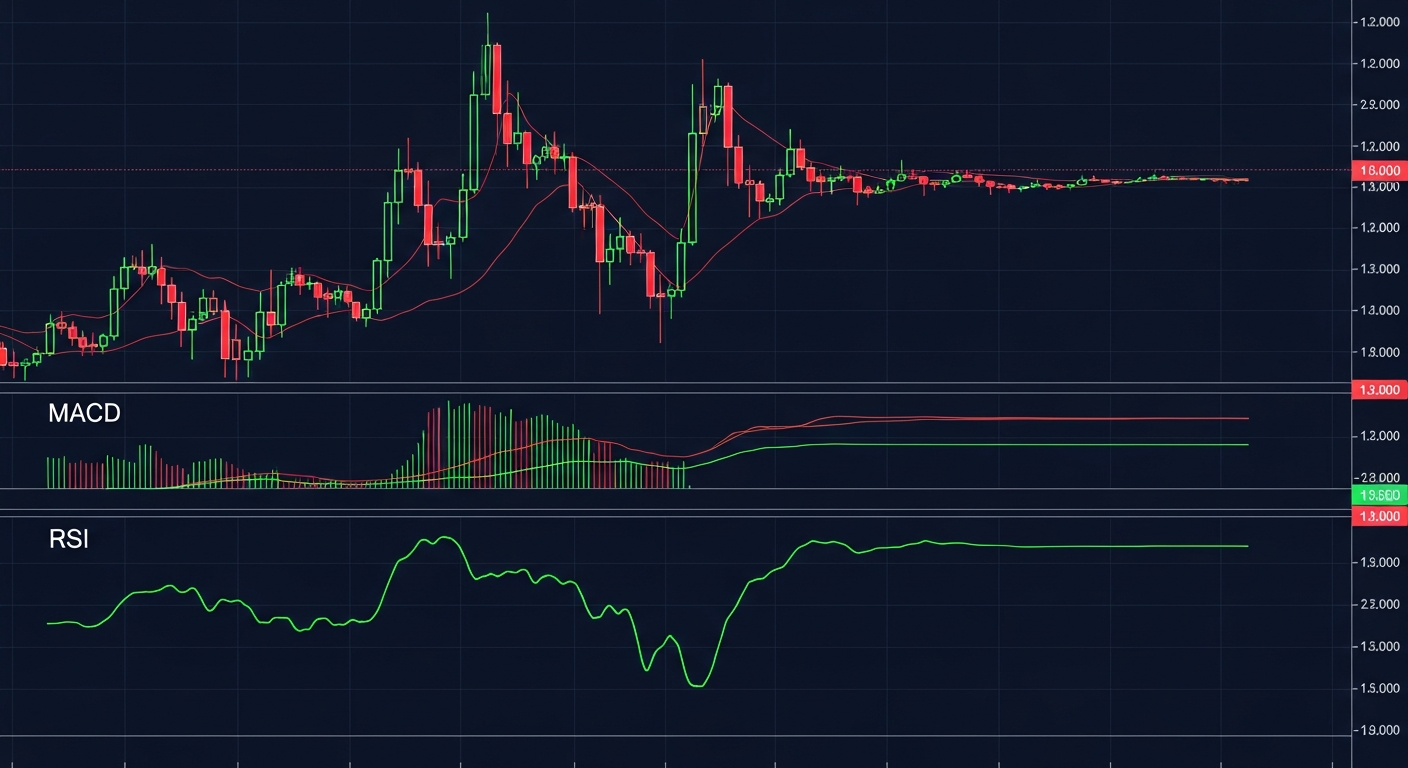
Real-time MACD Crosses
Stop guessing. Start executing.
Join traders who use MACD-RSI for their technical analysis edge. Get full access today.
Custom Alert Thresholds
Overbought (>70) and oversold (<30) thresholds tailored to the volatility of specific assets.
Signals indicated when the MACD line crosses the signal line, allowing you to catch trend reversals the second they happen.
Built on raw, unfiltered market data.
Indicators are only as good as the data feeding them. We process raw tick data to calculate MACD and RSI values with mathematical absolute precision, entirely bypassing the smoothing algorithms retail brokers use to save bandwidth.
RSI Divergence Engine
Automatically spot bullish and bearish divergences between price action and RSI momentum to predict hidden reversals.